New construction affecting views?
So there has a 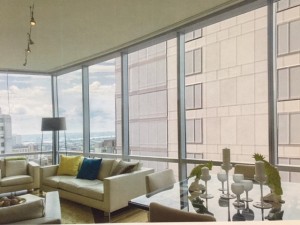 been a lot of talk recently within my circle of condo buyers in town about how the views of south facing units at the Ritz Carlton will be affected by the new building being erected to the south.
been a lot of talk recently within my circle of condo buyers in town about how the views of south facing units at the Ritz Carlton will be affected by the new building being erected to the south.This really only affects “A” units at the Ritz which face south and east. I was able to find an image showing what the views might one day look like.
In my opinion, when that new building is erected and buyers can actually see that it will be some 53 feet in distance from the Ritz- the effect on value(s) for the south facing condos will really not suffer a great deal.
I think the “unknown” may be more damning that the reality of what is going to be built.
My suggestion- throw some caution to the wind and look at the “A” units while you can and while their pricing may be a bit suppressed by the “unknown” element – that being partially blocked views.